🔬The Hidden Science That Saves Microservices
Microservice Coupling Metrics You’ve Never Heard Of (But Desperately Need)

“There are two ways of constructing a software design: One way is to make it so simple that there are obviously no deficiencies and the other way is to make it so complicated that there are no obvious deficiencies. The first method is far more difficult.” — Tony Hoare, Turing Award Lecture (1980)
The Change That Broke Everything
You rename a field in your Order service. Twelve minutes later, Inventory is throwing exceptions, Notifications won’t send, and Finance is asking why their dashboard shows infinite spinners.
One field. Three services down. Your "microservices" are a distributed monolith wearing a trench coat.

Here’s what nobody told you: simple mathematical ratios can predict these disasters before they happen. Not machine learning. Just division and occasionally an absolute value. Netflix uses these metrics. Uber built an architectural framework around them. The formulas have been hiding in plain sight since the 1990s.
Architecture entropy is measurable. Let me show you how.
Quick Reference: The Metrics At a Glance
| Metric | Formula | What It Reveals | Gathering |
|---|---|---|---|
| Afferent Coupling (Ca) | count(external dependents) |
Your responsibility—who breaks if you break | Static Analysis |
| Efferent Coupling (Ce) | count(external dependencies) |
Your vulnerability—who can break you | Static Analysis |
| Instability (I) | Ce / (Ce + Ca) |
Fragility spectrum: 0=stable, 1=volatile | Static Analysis |
| Abstractness (A) | Na / Nc |
Ratio of abstract to concrete types | Static Analysis |
| Distance from Main Sequence (D) | \|A + I - 1\| |
Deviation from optimal balance | Static Analysis |
| Temporal Coupling | sync_calls / total_calls |
Synchronous dependency risk | Service Mesh Telemetry |
| Change Coupling | co_commits(A,B) / commits(A) |
Hidden evolutionary dependencies | Git Analysis |
| Data Coupling | shared_tables > 0 |
Cross-service database entanglement | Schema Audit |
| Deployment Coupling | requires_coordinated_deploy |
Independent deployability (boolean) | Pipeline Analysis |
Part I: Package-Level Metrics (Inside Your Service)
Instability
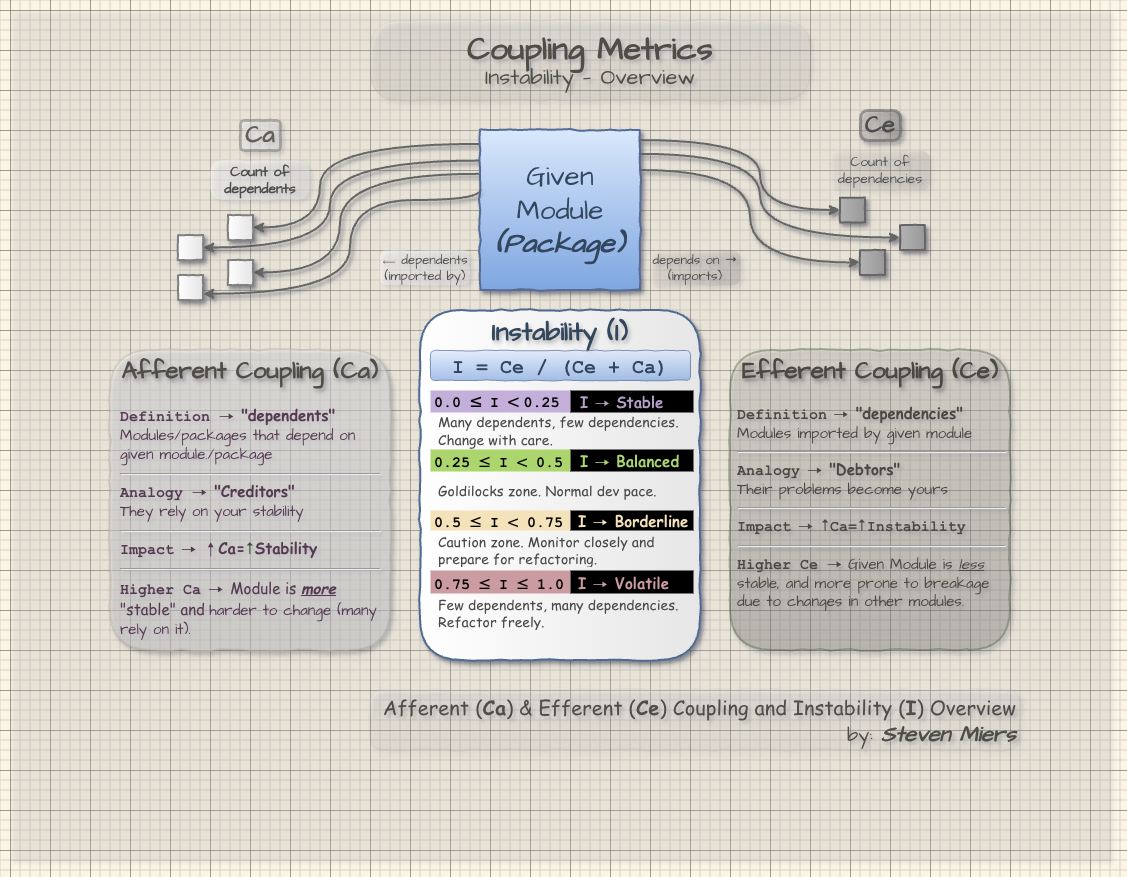
The Primitives: Ca and Ce
Every coupling metric builds from two counts:
| Metric | Counts | Analogy |
|---|---|---|
| Ca (Afferent) | External modules that import this module | Your creditors—they depend on your health |
| Ce (Efferent) | External modules this module imports | Your debts—their problems become yours |
def calculate_coupling(module):
    ca = count_modules_that_import(module)   # Who depends on me?
    ce = count_modules_imported_by(module)   # Whom do I depend on?
    return ca, ce
The Instability Index (I)
From Ca and Ce, one ratio tells you everything. A common distribution is:
I = Ce / (Ce + Ca)
I Range |
Stability | Meaning | Change Strategy |
|---|---|---|---|
| 0.0 ≤ I < 0.25 | Stable | Many dependents, few dependencies | Change with care |
| 0.25 ≤ I < 0.50 | Balanced | Goldilocks zone | Normal dev pace |
| 0.50 ≤ I < 0.75 | Borderline | Caution zone | Monitor closely; prepare for refactoring |
| 0.75 ≤ I ≤ 1.0 | Volatile | Few dependents, many dependencies | Refactor freely |
def calculate_instability(module):
    """I=0 means stable (many depend on you), I=1 means volatile (leaf node)."""
    ca = count_afferent_coupling(module)   # incoming dependencies
    ce = count_efferent_coupling(module)   # outgoing dependencies
    return ce / (ce + ca) if (ce + ca) > 0 else 0.0
Why it works: Like financial leverage. High Ca (many creditors) + low Ce (few debts) = fundamentally stable. The Stable Dependencies Principle says: dependencies should flow toward stability. When stable modules depend on unstable ones, you’ve created a time bomb.
Detecting SDP violations programmatically:
def check_stable_dependencies_principle(modules: list) -> list[str]:
    """SDP: dependencies should flow toward stability (lower I values)."""
    violations = []
    for m in modules:
        m_i = calc_instability(m)
        for d in m.dependencies:
            if (d_i := calc_instability(d)) > m_i:
                violations.append(format_violation(m, m_i, d, d_i))
    return violations
Abstractness and the Main Sequence
Abstractness measures interface-vs-implementation ratio:
A = Na / Nc (abstract classes / total classes)
def calculate_abstractness(module):
    """A=1 means all abstract, A=0 means all concrete."""
    abstract_count = count_abstract_types(module)  # interfaces, ABCs
    total_count = count_all_types(module)          # classes + interfaces
    return abstract_count / total_count if total_count > 0 else 0.0
Well-designed modules cluster along the Main Sequence where A + I = 1. The Distance metric measures deviation:
D = |A + I - 1|
def calculate_distance(module):
    """D=0 is ideal (on main sequence), D>0.7 warrants investigation."""
    a = calculate_abstractness(module)
    i = calculate_instability(module)
    return abs(a + i - 1)
The Danger Zones
| Zone | Coordinates | Problem | Example |
|---|---|---|---|
| Zone of Pain | Low A, Low I | Concrete AND stable—rigid, hard to extend | Database schemas, config modules |
| Zone of Uselessness | High A, High I | Abstract AND unstable—unused interfaces | Over-engineered abstractions |
| Main Sequence | A + I ≈ 1 | Optimal balance | Well-designed domain modules |
Target: D < 0.7. Values above warrant investigation.
Part II: Microservice-Specific Coupling
Package metrics work inside services. These work between them.
Coupling Types Comparison
| Type | Detection | Risk | Mitigation |
|---|---|---|---|
| Temporal | Runtime telemetry | Availability = ∏(service availabilities) | Circuit breakers, async messaging |
| Data | Schema audit | Implicit contracts, hidden dependencies | Database-per-service |
| Deployment | Pipeline analysis | Release trains, coordination overhead | Consumer-driven contracts (Pact) |
| Semantic | Domain review | Meaning drift across bounded contexts | Context mapping, explicit translation |
| Contract | API diff tooling | Breaking changes cascade | Versioning, backward compatibility |
Temporal Coupling: The Availability Multiplier
When Service A synchronously calls Service B:
System Availability = Availability(A) × Availability(B)
| Services in Chain | Individual Availability | Combined Availability |
|---|---|---|
| 1 | 99.9% | 99.9% |
| 2 | 99.9% | 99.8% |
| 3 | 99.9% | 99.7% |
| 5 | 99.9% | 99.5% |
def calculate_chain_availability(service_availabilities: list[float]) -> float:
    """Synchronous chain: availability multiplies (gets worse with length)."""
    result = 1.0
    for availability in service_availabilities:
        result *= availability
    return result

# Example: 3 services at 99.9% each
chain_availability = calculate_chain_availability([0.999, 0.999, 0.999])
# Result: 0.997 (99.7%) - lost 0.2% just from chain length
Netflix invented circuit breakers (Hystrix) because this math demanded it. Note: Hystrix is now in maintenance mode; resilience4j is the recommended alternative for new projects.
Data Coupling in CQRS Architectures
In event-sourced CQRS, data coupling should be eliminated: commands write events, projections build read models, each service owns its projections.
It sneaks back in through:
- “Just this one shared lookup table”
- “We’ll both read from customers—it’s faster”
- Cross-service foreign key references
Litmus test: If two services have write access to the same table, you have data coupling. Full stop.
def detect_data_coupling(services: list) -> list[tuple]:
    """Find services that share write access to the same tables."""
    violations = []
    for table in get_all_tables():
        writers = [s for s in services if s.can_write_to(table)]
        if len(writers) > 1:
            violations.append((table, writers))
    return violations
Keeping Read Models Fresh
| Pattern | Coupling Impact | Consistency | Use When |
|---|---|---|---|
| Read-your-writes | Medium | Strong | User expects immediate feedback |
| Write-through cache | Higher | Strong | Low-latency reads critical |
| Optimistic UI | Lower | Eventual | Users tolerate brief staleness |
Part III: Change Coupling—Your Git History Knows
Change coupling identifies files that frequently change together in commits, revealing dependencies invisible to static analysis.
Change Coupling(A,B) = co_commits(A,B) / total_commits(A)
def calculate_change_coupling(file_a: str, file_b: str, commits: list) -> float:
    """Higher value = files change together more often (hidden coupling)."""
    commits_with_a = [c for c in commits if file_a in c.files]
    commits_with_both = [c for c in commits_with_a if file_b in c.files]
    return len(commits_with_both) / len(commits_with_a) if commits_with_a else 0.0
If order_service/validators.py and notification_service/templates.py changed together in 47/50 commits, they’re coupled—regardless of imports.
| Trend | Interpretation | Action |
|---|---|---|
| Growing | Entanglement increasing | Investigate, likely refactor |
| Stable | Known technical debt | Document, monitor |
| Decreasing | Refactoring working | Continue current approach |
Part IV: Service Granularity Trade-offs
| Granularity | Symptom | Coupling Problem |
|---|---|---|
| Too fine | Every request = network call cascade | Excessive inter-service/temporal coupling |
| Too coarse | “Microservice” is a monolith with K8s | High intra-service coupling, deployment coupling |
| Just right | Independent deploy, bounded context aligned | Coupling contained within domain boundaries |
Uber’s DOMA organizes 2,200 services into 75 domains across 5 layers, with explicit rules about which layers can depend on which. Coupling metrics enforce those rules.
Part V: Advanced Gathering
Python: Import Analysis and Dependency Graphs
Visualization with pydeps:
pydeps your_service --cluster --max-bacon=2 -o deps.svg
Architectural enforcement with import-linter:
# .importlinter
[importlinter:contract:layers]
name = Layered Architecture
type = layers
layers =
    api
    domain
    infrastructure
containers = your_service
Metrics calculation with py_coupling_metrics (experimental):
pip install py_coupling_metrics
py-coupling-metrics ./src --output metrics.json
Ruby: Complexity and Smell Detection
| Tool | Measures | Command |
|---|---|---|
| Flog | ABC complexity (coupling hotspots) | flog app/services/ |
| Reek | Feature Envy, Control Couple smells | reek app/models/ --format json |
| RubyCritic | Aggregated report with grades | rubycritic app/ |
Git History Analysis for Change Coupling
Code Maat (language-agnostic):
# Generate git log
git log --all --numstat --date=short \
  --pretty=format:'--%h--%ad--%aN' > gitlog.txt

# Analyze coupling
java -jar code-maat.jar -l gitlog.txt -c git2 -a coupling
Service Mesh Telemetry for Runtime Coupling
| Tool | Capability |
|---|---|
| Istio/Linkerd | Auto-instrumented service-to-service metrics |
| Kiali | Traffic-inferred dependency graphs |
| OpenTelemetry | Distributed tracing across services |
| Jaeger | Trace visualization and analysis |
Schema and Contract Analysis
| Concern | Tool/Approach |
|---|---|
| Data coupling | Query logs, schema ownership audit |
| Contract coupling | Pact (Consumer-Driven Contracts) |
| Deployment coupling | CI/CD pipeline dependency analysis |
Your First Coupling Audit: This Week
| Step | Action | Tool |
|---|---|---|
| 1 | Find most-changed service | git log --stat |
| 2 | Visualize internal deps | pydeps / manual graph |
| 3 | Calculate I for 3-5 modules | Spreadsheet: Ce/(Ce+Ca) |
| 4 | Check change coupling | Code Maat |
| 5 | Ask: “Can this deploy alone?” | Honest conversation |
The Bottom Line
| What | Old Way | Metrics Way |
|---|---|---|
| Coupling assessment | “Feels tightly coupled” | I=0.9 depending on I=0.2—violation |
| Architecture review | Whiteboard intuition | D > 0.7 flagged in CI |
| Refactoring priority | Loudest complaints | Highest change coupling scores |
The teams that sleep soundly—Netflix, Uber, Spotify—aren’t guessing about architecture. They’re measuring it.
Your homework: Pick one metric. Calculate it for one service. This week.
Entropy is measurable. Start measuring.
References
-
Martin, R.C. (1994). “OO Design Quality Metrics: An Analysis of Dependencies.”
-
Martin, R.C. (2017). Clean Architecture: A Craftsman’s Guide to Software Structure and Design. Prentice Hall.
-
Uber Engineering. (2020). “Introducing Domain-Oriented Microservice Architecture.” Uber Engineering Blog.
-
Netflix. “Hystrix: Latency and Fault Tolerance Library.” GitHub Repository. (Now in maintenance mode; see resilience4j)
-
Tornhill, A. (2015). Your Code as a Crime Scene. Pragmatic Bookshelf. Tool: Code Maat.
-
Richardson, C. “Microservice Architecture Essentials: Loose Coupling.” microservices.io.
-
Pact Foundation. “Consumer-Driven Contract Testing.” Pact Documentation.